
Google Analytics Dashboard for a Web Area
Legacy content
This page is for Universal Analytics (UA). Find a page like this for Google Analytics 4 (GA4)
EPA content related to Google Analytics is changing.
Google's legacy platform, Universal Analytics (UA), will reach end of life in mid-2023 with a one-time extension for contracting clients such as EPA until July 1, 2024. See KB article.
In these Web Analytics pages, content for Universal Analytics is marked "Google Universal Analytics (legacy)."
Content for the new platform, Google Analytics 4, is marked "Google Analytics 4 (GA4)."
On this page:
The EPA standard dashboard shows:
- Number of visitors
- Time spent on a web area page
- Number of pages visited in a web area
- Whether the audience is mobile
- How people got to the site
- Organic = external search engine
- Referral = linked from another web page
- None = typed in URLs
- Social media use
- Top 10 HTML pages
- Top 10 PDF files
- Top external search terms
- Top terms used in the search box on the web area pages
- Top external referrers
- Top internal referrers
How to build a dashboard
- Log into Google Analytics. www.google.com/analytics
- “Sign In” in upper right and Choose “Google Analytics Premium” which is the one we use for the EPA Contract.
- Select the EPA Enterprise View under the EPA Enterprise section.
- Go to Dashboards on the left sidebar, and then select Shared.
- Select the About EPA Metrics Dashboard dashboard.
- Go to the Share button and select Share Template link.
- Copy the Share Template URL. Using the CTRL and C keys at the same time will copy the link.
- Close the Share Template URL box.
- Paste the Template link in the address bar. A box will open:

- In the drop box titled Select a view, select EPA Enterprise View.
- In the box below, enter the name of your web area.
- Then select the Create button.
Note: Your dashboard will be created as a Private dashboard. This is okay and will not limit the functionality of your dashboard. You do not need to make it Shared.
- The dashboard you just created will open.
- To make it so that your dashboard shows the analytics for your web area, edit the first widget (what each of these blocks is called in google analytics) by clicking on the pencil:
- Change the URL from epa.gov/aboutepa to your web area URL. For example, if your site is https://www.epa.gov/endocrine-disruption then change epa.gov/aboutepa to epa.gov/endocrine-disruption
- Do this for all the widgets.

TA DA! You now have a dashboard.
Emailing the report
Now that the dashboard is made, you can have GA email you monthly reports. It can also send daily, weekly, and quarterly reports. Monthly reports are easier to manage.
- Select Email from the dashboard tool bar.
- Add your email address.
- Give the email a meaningful subject and put useful information in the message.
- For Frequency, select monthly delivery. For Day of the Month, select the 2nd. It takes overnight to load the data for the previous day, so this way you will get the previous month's data.
- Click the Send button. You will now receive the report on a monthly basis in your email inbox.
- To send to multiple emails, comma-separate the addresses in the To field.
Adding more than one report on an email
- To add your new dashboard report to an existing report, select "Add to an existing email" in the lower right hand corner of the Email box.
- You may add as many reports to an email as you like.
Extending the end date of the report
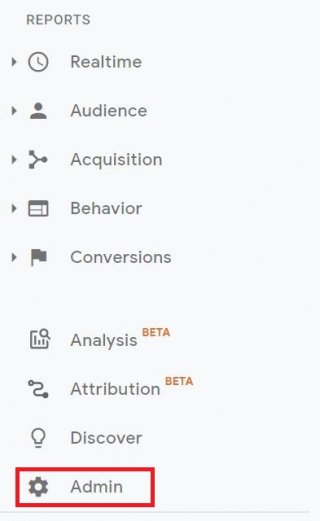
- When you create your monthly report, it will set an expiration date. Select Admin from the left side navigational menu to extend this date.
- Select the Scheduled Emails item on the right.
- You will see the scheduled email list. You will only see emails you've scheduled with your account.

- Click on the Actions button. Select Extend from the menu.

Note: Look for the expiration date when you create a monthly report. Then use your Outlook calendar to send yourself a reminder to extend it before it expires.