Understanding the Explore Area in GA4
EPA content related to Google Analytics is changing.
Google's legacy platform, Universal Analytics (UA), will reach end of life in mid-2023 with a one-time extension for contracting clients such as EPA until July 1, 2024. See KB article.
In these Web Analytics pages, content for Universal Analytics is marked "Google Universal Analytics (legacy)."
Content for the new platform, Google Analytics 4, is marked "Google Analytics 4 (GA4)."
The primary tool for drilling down to web area data in GA4, is the exploration (also called an analysis). In the explore area of GA4, it is possible to segment and filter data, and to produce a report that can be downloaded to your computer. (Note: at this time, GA4 does not offer the ability to schedule reports to be sent by email.)
This page discusses the Explore area of GA4 and what an exploration is.
On this page:
- Explore Area in the GA4 UI
- Sections of an Exploration
- Variables:
Exploration Name, Date Range(s), Segments, Dimensions, Metrics - Tab Settings:
Technique, Visualization, Segments to compare, Rows, Columns, Values, Filters - Tabs (a.k.a., Report tabs)
- Variables:
Explore Area in the GA4 UI
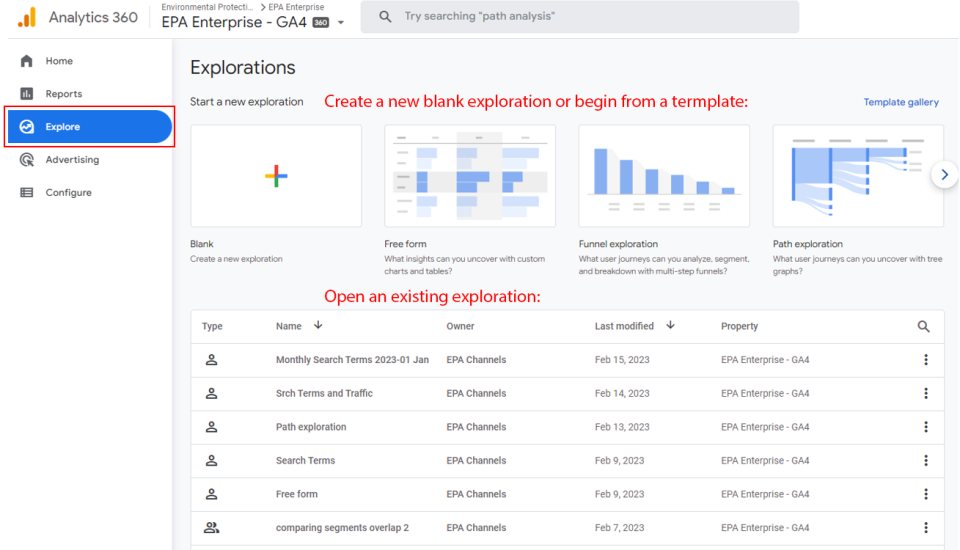
Explore is an area in the Google Analytics 4 user interface.
In Explore, you can create a blank (empty) exploration, use a template to create a fresh exploration with a particular format, or open any of the existing explorations listed down this page.
Share an exploration
You can share an exploration you created in GA4 with colleagues. To share:
- Click the three-dots button on the far right in the row for your exploration.
- Select "Share" from the menu


Sections of an Exploration
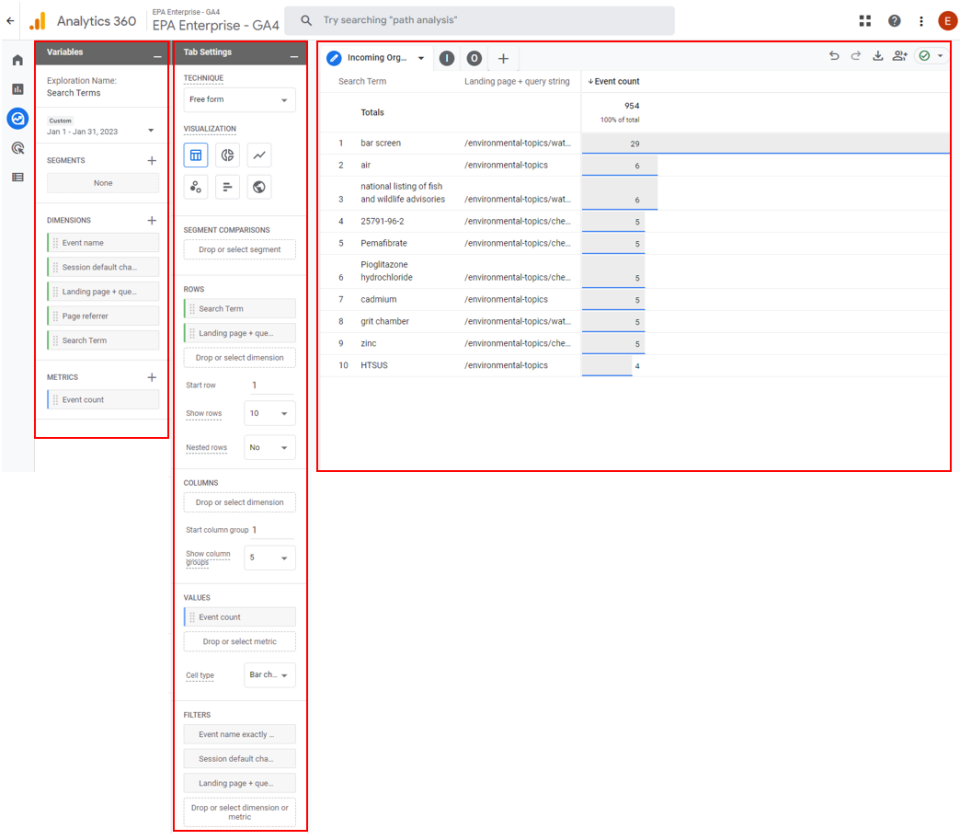
An exploration is comprised of three sections: Variables, Tab Settings, and Tabs (reports).
Variables
Exploration name and date ranges
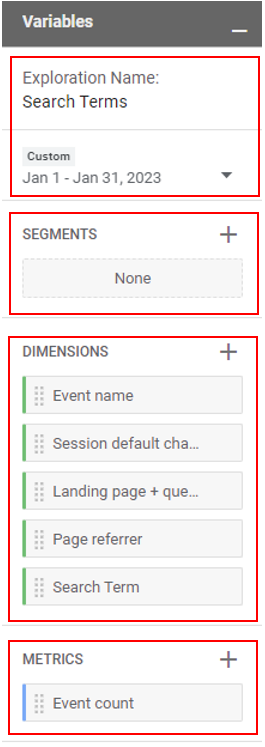
Click below “Exploration Name” to enter or change the name. The text you type is saved automatically.
You can select two date ranges for comparison.
Segments
Create up to ten segments configured to pre-limit the Users, Sessions, and Events in reports. For example, a segment could be ‘all mobile users’ or ‘users who viewed a page or web area.’
See Using Segments in GA4 for more detail.
About Dimensions and Metrics
Dimensions and metrics are the basis of every report in Google Analytics 4. The specific dimensions and metrics you can choose and combine for a given report will vary. They can be used in combinations that are compatible, and they also are available for certain types of reports.
You can browse Google Analytics 4 dimensions and metrics here:
https://support.google.com/analytics/answer/9143382 (not including custom dimensions and metrics)
It’s also helpful to know that EPA’s implementation of Google Analytics 4 includes several custom dimensions and metrics.
If you are logged into Google Analytics, you can check available combinations of dimensions and metrics by going to: https://ga-dev-tools.web.app/ga4/dimensions-metrics-explorer/ (disconnect from VPN in order to use this tool). This tool will also show EPA’s custom dimensions and metrics.
See Dimensions and Metrics in GA4 for more detail.
Dimensions
Add up to ten dimensions.
Dimensions added to a report in GA4 become the textual rows and columns of the report.
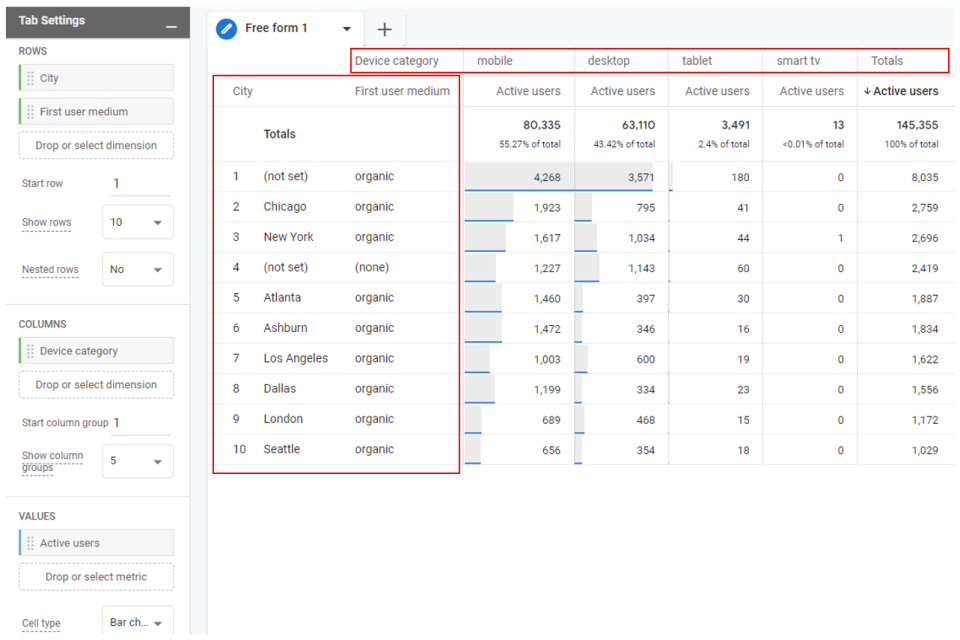
In the example below, the rows come from the dimensions City and First user medium and columns come from the dimension Device category.
Metrics
Add up to ten metrics.
Metrics added to a report in GA4 become the numeric data cells of the report. In the example below, the data cells show values for the metric Active users.
In the example above, cell values come from the metric Active users, as specified under Tab Settings.
Tab Settings

Technique
Specify the technique to use in the report.
The technique that will be most useful for routine analysis of web area performance is free form. This technique combined with table visualization displays a familiar data table format and gives the option to download the data in CSV form so it can be opened in Excel.
Other techniques available in GA4 could be helpful but may be used less frequently. These include: cohort exploration, funnel exploration, segment overlap, path exploration, user explorer, and user lifetime. As the names imply, they relate to specific kinds of questions that might be asked about usage of the website.
Visualization
Specify the visualization to use in the report.
Visualization has to do with the visual display of the report, and the primarily one is table, as this displays a familiar data table format and gives the option to download the data in CSV form so it can be opened in Excel.
There are visualization styles associated with the “free form” technique that could be of interest to EPA web content managers. These include: Donut chart, Line chart, Scatter plot, Bar chart, and Geo map.
Segment Comparisons
Specify the segments to use in the report (if desired).
If you create more than one segment under “Variables” for your analysis, these can be brought into the report here and the report will break out the data by segment for easy comparison between segments. For instance, if one segment was for “new users” and another for “returning users,” these could be compared in a single report.
Segments can be based on user properties and/or parameters of sessions or events.
When thinking about segments and reports, it is important to align segments with the intended output of the report so that they are “about” the same things. For instance, if the report is primarily about events and event parameters, then the ideal segments to use would be event- or session-based. If the report is focused on user properties, then user-based segments would be best.
Rows
Specify the dimensions to use as rows in the report.
Rows of the report are comprised of dimensions, selected from available dimensions under the “Variables” section of the analysis. If the dimension you want in the report is not already in the analysis, it must be added before it can be used.
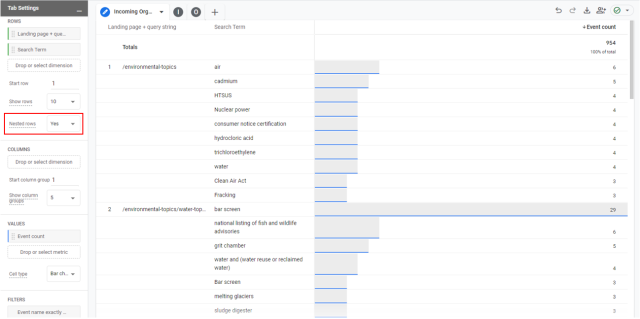
If more than one dimension is specified for the report, they will become additional values in the left side of the report at the start of each row. They can be nested or not nested. Nesting would group rows by values in the first dimension.
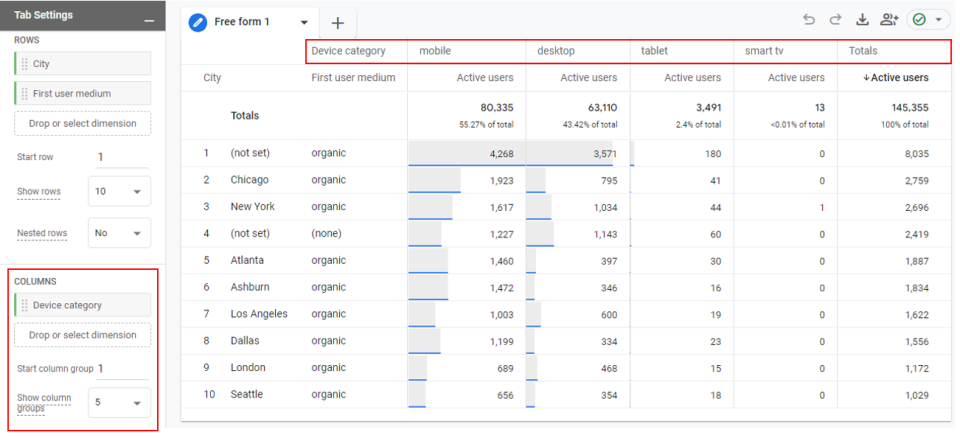
Example with Nested rows set to "No" -
(click image to enlarge)

Example with Nested rows set to "Yes" -
(click image to enlarge)
Columns
Specify the dimensions to use as columns in the report.
Columns are also comprised of dimensions, selected from available dimensions under the “Variables” section of the analysis. If the dimension you want in the report is not already in the analysis, it must be added before it can be used.
Values
Specify the metrics to use as values in the report.
Values are comprised of metrics, selected from available metrics under the “Variables” section of the analysis. Numbers displayed in the final report come from the metrics specified here.
For instance, the metric “event count” is very commonly used in Google Analytics 4, because in the underlying data model “everything is an event.”
Event count can mean different things based on how events are filtered in GA4. For example:
- If the event name is “page_view”, then event_count is the number of page views.
- If the event name is “downloads,” then event count is the number of times the link for the download was clicked.
- If the event name is “scroll,” then event count is the number of times a page was scrolled to 90%.
Note: If the report does not use filters, data displayed can be from any or all event types (page_view, downloads, scroll, etc.). For this reason, it is best to filter a report to the event type being analyzed. See Using Filters in GA4 for more detail.
Filters
Specify the filters (if desired) by which to limit or focus the report.
Filters can be added to a report based on any of the dimensions or metrics available under “Variables” section of the analysis. Filters are useful, even necessary, in a report to give the report focus. Without them, the report is based on ALL the data in Google Analytics 4 for the specified date range. It would include ALL events, all traffic sources, all pages.
Some common filters to utilize are:
- Event name: focus the report on a certain type of event such as “page_view.”
- Page path or Web area: focus the report on a certain page or set of pages or web area.
- Page path + query string
- Web area = “Laws & Regulations”
- Page referrer: focus the report on a page or set of pages visitors were on immediately prior to the event you are reporting on. (This was called previous page path in google Universal Analytics.)
See Using Filters in GA4 for more detail.
Tabs (a.k.a., Report tabs)
A single exploration can have one to ten reports, shown as tabs. There is a plus sign (+) button at the end for adding a new tab.

Only one tab title is visible at a time (e.g., "Users" above), and the others are collapsed to show only the first letter of their title. To see a tab title when it is collapsed, either click or hover over the tab.
The format and details of a report directly reflect choices made in the tab settings area.
With report tabs, you can:
- Drag to re-order
- Rename a tab (e.g., “Organic Incoming Search”)
- Download data from a tab to your computer
Rename a report tab
- Click in the name to place the cursor. (Don't try to highlight the name by dragging across – this will drag the tab.)

- Use backspace to delete the name
- Type the new name
- Hit Enter
Download report data from a report tab to your computer
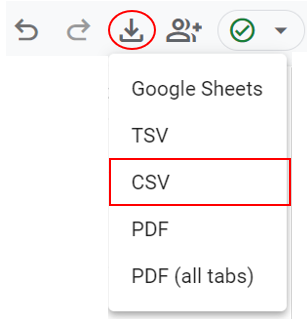
Click the Export data button, choose CSV for a file compatible with Excel
