Understanding the Home and Reports Areas in GA4
EPA content related to Google Analytics is changing.
Google's legacy platform, Universal Analytics (UA), will reach end of life in mid-2023 with a one-time extension for contracting clients such as EPA until July 1, 2024. See KB article.
In these Web Analytics pages, content for Universal Analytics is marked "Google Universal Analytics (legacy)."
Content for the new platform, Google Analytics 4, is marked "Google Analytics 4 (GA4)."
This page describes the general charts and information available in the Home and Reports areas in Google Analytics 4, and options for interacting with the charts. There are also detailed reports available in GA4. For information on the various detailed reports, see Understanding Detailed Reports in GA4.
On this page:
Home screen
At the top of the page are two charts offering a broad overview of site performance:
- Event count, Users, Total users, Event count per user (last 7 days)
- Users by country (last 30 minutes)
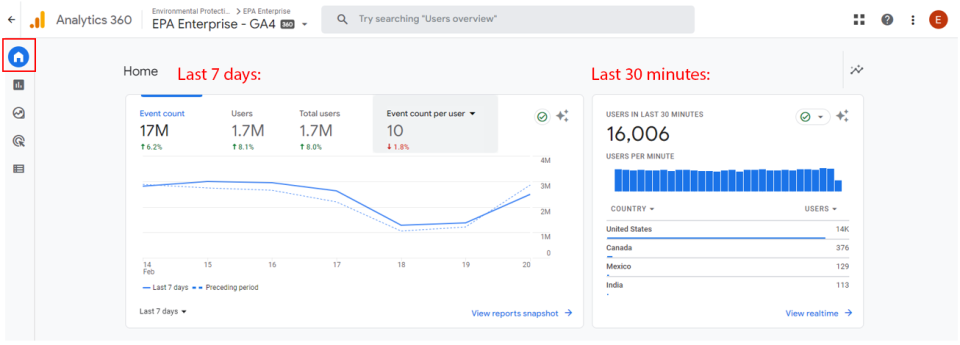
To change the metrics displayed here, click on any of the visible metrics.
- For example, click on Event count, then choose another metric.

NOTE regarding the GA4 home screen:
Options for filtering or downloading the data are missing from the GA4 home screen. This area is meant to give only a high-level overview of EPA web performance.
To drill down to more specific details or for the ability to report on a particular subset of users, pages, or a web area:
- click the “View…” link displayed at the bottom of one of the charts shown on the home screen.
(for example, “View reports snapshot” or “View realtime”), OR - click the Reports tab in the menu on the left, OR
- click the Explore tab in the menu (see Using Explore in GA4 for more information on this tool)
Reports
About Reports
In the Reports area, GA4 shows more information than on the home screen. For instance, in the overview reports shown below, you can learn more about realtime activity on the site, view report snapshots, and view general reports for several categories of web analytics. (For an outline of detailed reports in this area, see Understanding Detailed Report in GA4. Detailed reports include: user acquisition, user engagement, events, pages and screens, user demographics, user technology, and search queries.)
In all the Reports pages, you can:
- Set the desired date range for charts in the report

- Add and edit criteria for comparisons (e.g., mobile users; users who viewed a page or web area)

Pages in the Reports area provide three levels of detail:
- Reports snapshot (most general)
- Overview reports (e.g., Acquisition, Engagement, Demographics, Tech)
In overview reports, you can also:- Download a report to your computer in PDF or CSV format

- Download a report to your computer in PDF or CSV format
- Detailed reports (most specific)
(e.g., User acquisition, Traffic acquisition, Events, Pages and screens, Demographic details, User tech details, Search queries)
To learn more about the detailed report pages in GA4, see Understanding Detailed Reports in GA4.
In detailed reports, you can also:- Download a report to your computer in PDF or CSV format

- Apply custom filters across all charts in a report

- Download a report to your computer in PDF or CSV format
Reports snapshot
How to get to the reports snapshot page
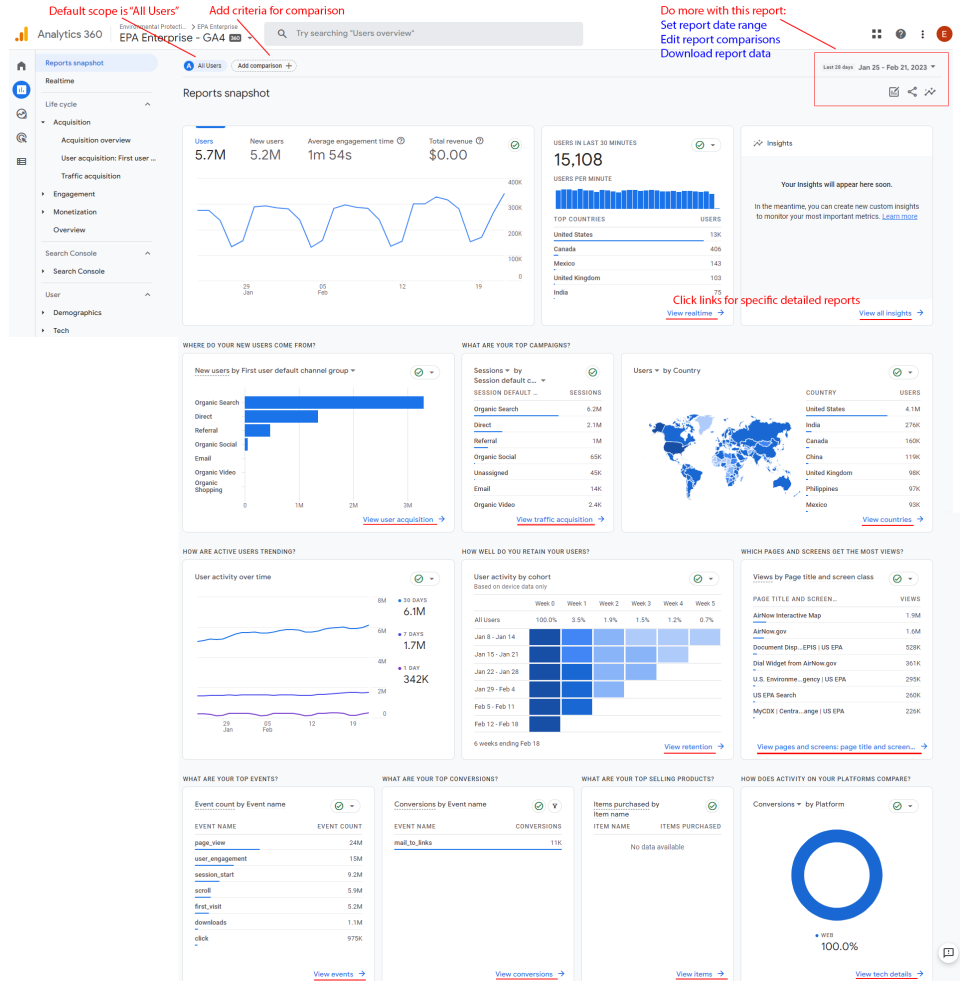
- Click Reports > Reports snapshot
Interact with the charts
- Set the desired date ranges for charts in the report
- Add and edit criteria for comparisons (e.g., mobile users; users who viewed a page or web area)
- Click the share button to download report data
- Click links at the bottom of charts for specific detailed reports
Charts included in this page
- Users, New users, Average engagement time
- Users in last 30 minutes
- Where do your new users come from?
- Users by country with map
- How are active users trending?
- How well do you retain your users?
- Which pages and screens get the most views?
- What are your top events?
Realtime
How to get to the realtime page
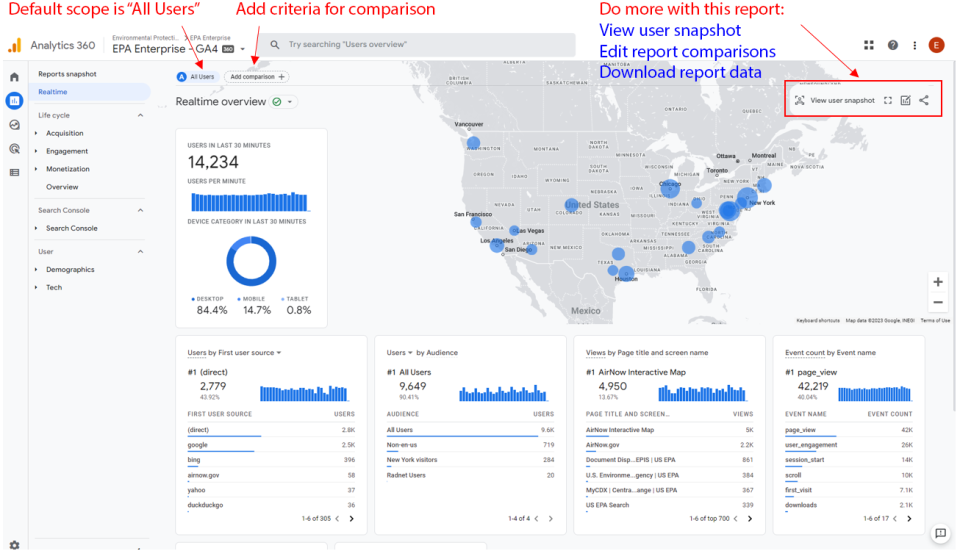
- Click Reports > Realtime
Interact with the charts
- Add and edit criteria for comparisons (e.g., mobile users; users who viewed a page or web area)
- Click the share button to download report data
Charts included in this page
- Users in the last 30 minutes
- US Map showing locations of users (hover for counts)
- Users by First user source
- Users by Audience
- Views by Page title and screen name
- Event count by Event name
Overview Reports
Acquisition overview
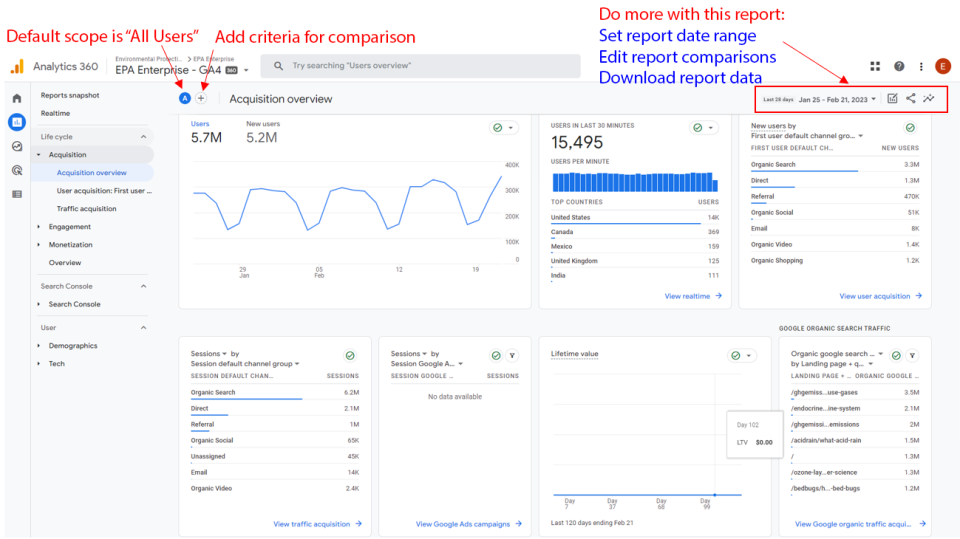
Here, we see general information related to how users came to the EPA website. The charts on this page show how new users find the EPA website as well as overall traffic sources.
For instance, a chart for Session Default Channel Group gives a high-level view of how users came to the site: Organic Search or Direct are typically the top two categories. Organic Search means users came from Google or Bing search engines and Direct means they came with a bookmark or entered your URL directly.
How to get to the acquisition overview page
- Click Reports > Life cycle > Acquisition > Acquisition overview
Interact with the charts
- Set the desired date ranges for charts in the report
- Add and edit criteria for comparisons (e.g., mobile users; users who viewed a page or web area)
- Click the share button to download report data
Charts included in this page
- Users and New users
- Users in last 30 minutes
- New users by First user default channel group
- Sessions by Session default channel group
- Organic google search impressions by Landing page + query string
- Organic google search clicks by Organic google search query
Engagement overview
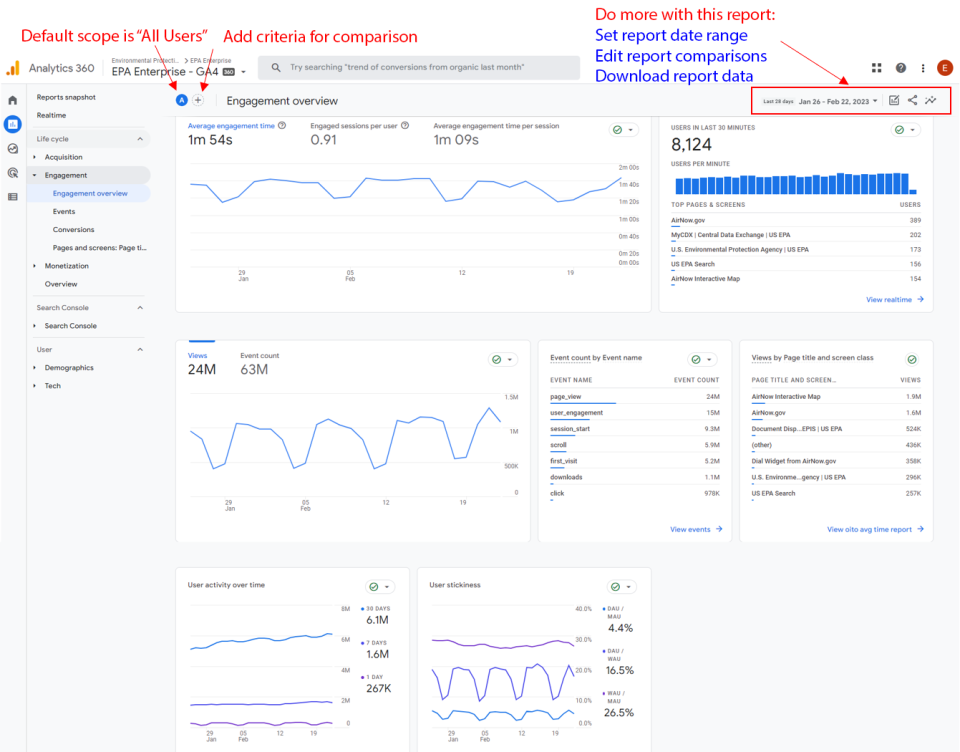
“Engagement” in GA4 means activity on the website – viewing pages, slowly scrolling (i.e. reading), clicking links, downloading documents.
User engagement is the amount of time someone spends with your web page in focus or app screen in the foreground, which allows you to measure when users actively use your site or app.
To account for user engagement in GA4, all actions performed by users on the website are recorded as events. This makes it necessary to understand events and how to filter them. (See also: Using Filters in GA4.) In GA4 reports, "active users" and "users" are labels for the metric Active Users. To compare this with all users, look for the metric Total Users.
The Engagement Overview report page shows general information about visitors and how they are using the website.
How to get to the engagement overview page
- Click Reports > Life cycle > Engagement > Engagement overview
Interact with the charts
- Set the desired date ranges for charts in the report
- Add and edit criteria for comparisons (e.g., mobile users; users who viewed a page or web area)
- Click the share button to download report data
Charts included in this page
- Average engagement time, Engaged sessions per user, Average engagement time per session
- Users in last 30 minutes
- Views, Event count
- Event count by Event name
- Views by Page title and screen class
- User activity over time
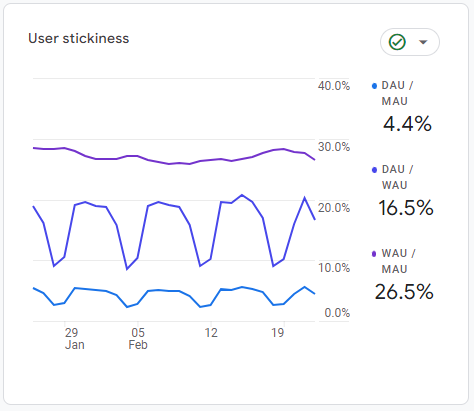
- User stickiness
About user stickiness
With GA4, Google has created what they call "stickiness" metrics which compare a site’s active users over time. The metrics are Daily Active Users, Weekly Active Users, and Monthly Active Users, DAU, WAU and MAU. Google creates ratios of these to give a high-level picture of how the site is performing in terms of user engagement and bringing users back to the site. (See Retention overview below.)
If you want to use these numbers, initially study them to get a baseline sense of the numbers and then watch them over time to see trends and patterns and to notice changes from the norm.
Retention overview
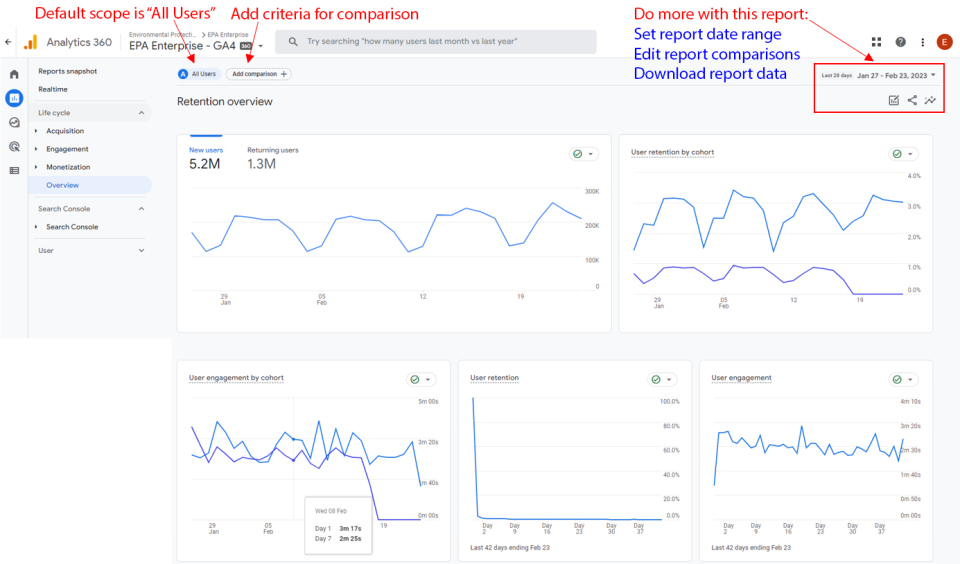
How to get to the retention overview page
- Click Reports > Life cycle > Overview
Interact with the charts
- Set the desired date ranges for charts in the report
- Add and edit criteria for comparisons (e.g., mobile users; users who viewed a page or web area)
- Click the share button to download report data
Charts included in this page
- New Users, Returning users
- User retention by cohort
- User engagement by cohort
- User retention
- User engagement
User demographics overview
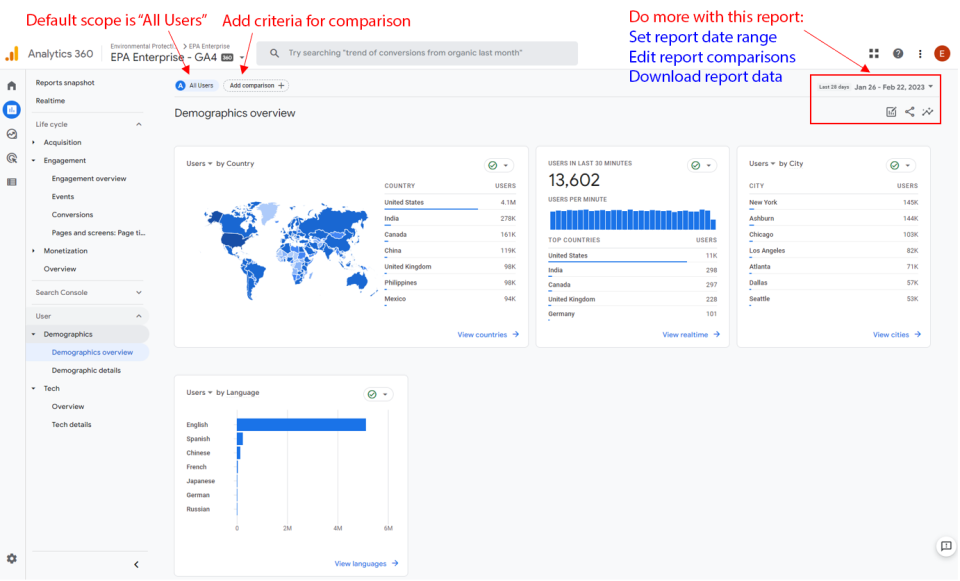
In this area, we can see high-level information about visitors to the site. We see such information as: Country, City, Language.
How to get to the demographics overview page
- Click Reports > User > Demographics > Demographics overview
Interact with the charts
- Set the desired date ranges for charts in the report
- Add and edit criteria for comparisons (e.g., mobile users; users who viewed a page or web area)
- Click the share button to download report data
Charts included in this page
- Users by Country
- Users in last 30 minutes
- Users by City
- Users by Language
User tech overview
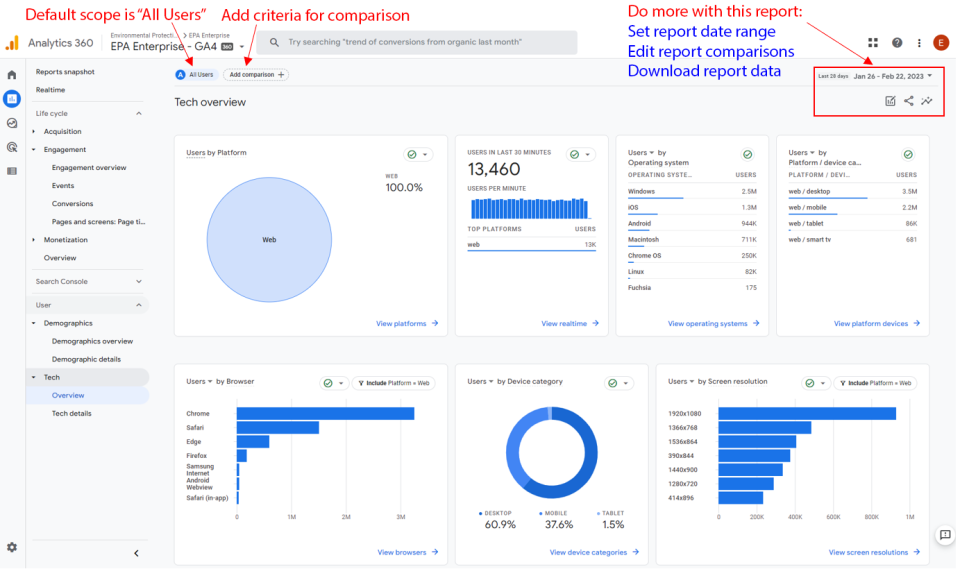
In this area, we can see high-level information about User technology as they visit the site. We see such information as: Operating System, Device Category, Browser, Screen Resolution.
How to get to the tech overview page
- Click Reports > User > Tech > Overview
Interact with the charts
- Set the desired date ranges for charts in the report
- Add and edit criteria for comparisons (e.g., mobile users; users who viewed a page or web area)
- Click the share button to download report data
Charts included in this page
- Users by Platform
- User in last 30 minutes
- Users by Operating system
- Users by Platform / device category
- Users by Browser
- Users by Device category
- Users by Screen resolution
Save a report as an exploration
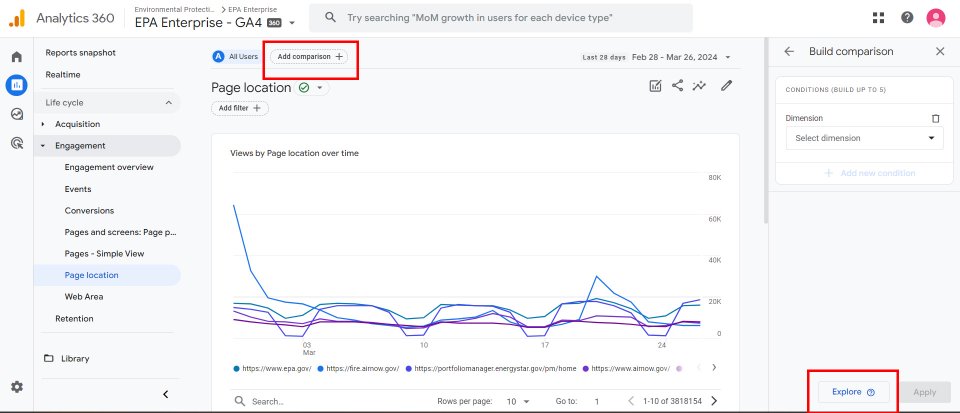
If you would like to save your report, you can save it as an exploration. From your report, select the “Add comparison” button, then the “Explore” button in the lower right hand corner. It will open the report in the Explorations tab and in a create a segment window. Select the cancel button to go to the Exploration. Understanding the Explore Area in GA4.
