Understanding Google Analytics 4
EPA content related to Google Analytics is changing.
Google's legacy platform, Universal Analytics (UA), will reach end of life in mid-2023 with a one-time extension for contracting clients such as EPA until July 1, 2024. See KB article.
In these Web Analytics pages, content for Universal Analytics is marked "Google Universal Analytics (legacy)."
Content for the new platform, Google Analytics 4, is marked "Google Analytics 4 (GA4)."
The videos on this page are taken from Google Analytics YouTube Channel. Google Analytics does offer a free course for Google Analytics 4 in Skillshop it is strongly recommended that you take the entire course if you plan to be a regular user of Google Analytics. Once you are comfortable with the basics below, learn how to Make Google Analytics Work for You.
On this page:
- Getting started with Google Analytics 4 Property
- Dimensions and Metrics
- Users
- Reports
- Explorations
- Share and export the exploration
Getting started with the Google Analytics 4 Property
Google Analytics is a platform that collects data from websites and apps to create reports that provide insights for owners and producers on how to best serve their users. This video goes over the the basics of the new Google Analytics 4 property.
To learn more about how Google Analytics 4 is implemented at the EPA, see Google Analytics 4: Data and Structure.
Dimensions and Metrics
As a result of changes to the data model, some Dimensions and Metrics have changed and others are new with Google Analytics 4. A few dimensions and metrics are populated automatically when Google Tag is added to a website while others require some configuration before they're populated.
Dimensions describe and define data, whereas Metrics measure data. Dimensions are the attributes of your data in GA4 (e.g. Events, City). You can use an event to measure when someone loads a page or clicks a link. Metrics are the quantitative data available on your GA4 property (e.g. Sessions, Pageviews).
You can look over the Metrics available in Google Analytics in the Glossary of Metrics Used in Google Analytics.
Users
If comparing your newly reported results in the Google Analytics 4 properties against those in Universal Analytics properties, keep in mind that the term Users has a different calculation for this metric in UA and GA4. Universal Analytics highlights Total Users (shown as Users) in many reports. GA4 focuses on Active Users (also shown as Users). You can compare Total Users from UA to Total Users in GA4 by using Explorations in GA4 to find your total users.
Active Users are the primary user metric in GA4, the number of distinct users who visited your website or application. An active user is any user who has an engaged session or when Analytics collects:
- the first_visit event or engagement_time_msec parameter from a website
- the first_open event or engagement_time_msec parameter from an Android app
- the first_open or user_engagement event from an iOS app
Reports
Google Analytics collects data from the websites that are requested to create reports that can monitor traffic, investigate data, and understand users and their activity. Once Google Analytics 4 starts to receive data, the data appears in the Realtime report and then in subsequent reports. Some data does not automatically begin collecting and requires some additional setup. Those can be found under the Reports tab.
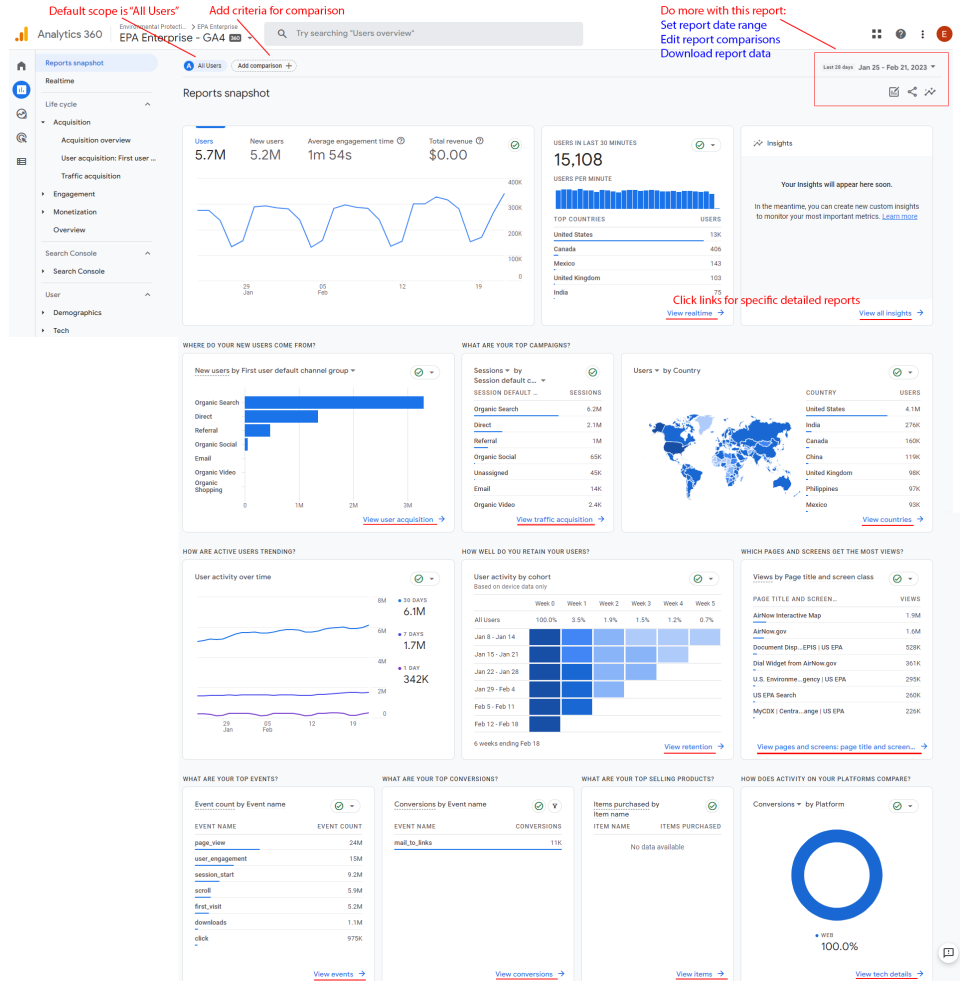
When getting started with Google Analytics, you will see a Reports snapshot, a Realtime report, and various predefined reports. Everyone with access to the Analytics property will see the same set of reports. Those reports include:
- An overview report is a report that summarizes information about a topic; for example, the Acquisition overview and Engagement overview reports.
- A detail report is a report that allows you to drill into one or two dimensions to investigate your data in greater detail; for example, Events reports.
One of the best ways to learn about Google Analytics reporting is by clicking around and seeing how it works for yourself. There is plenty of guidance available at Google Analytics Help.

Explorations
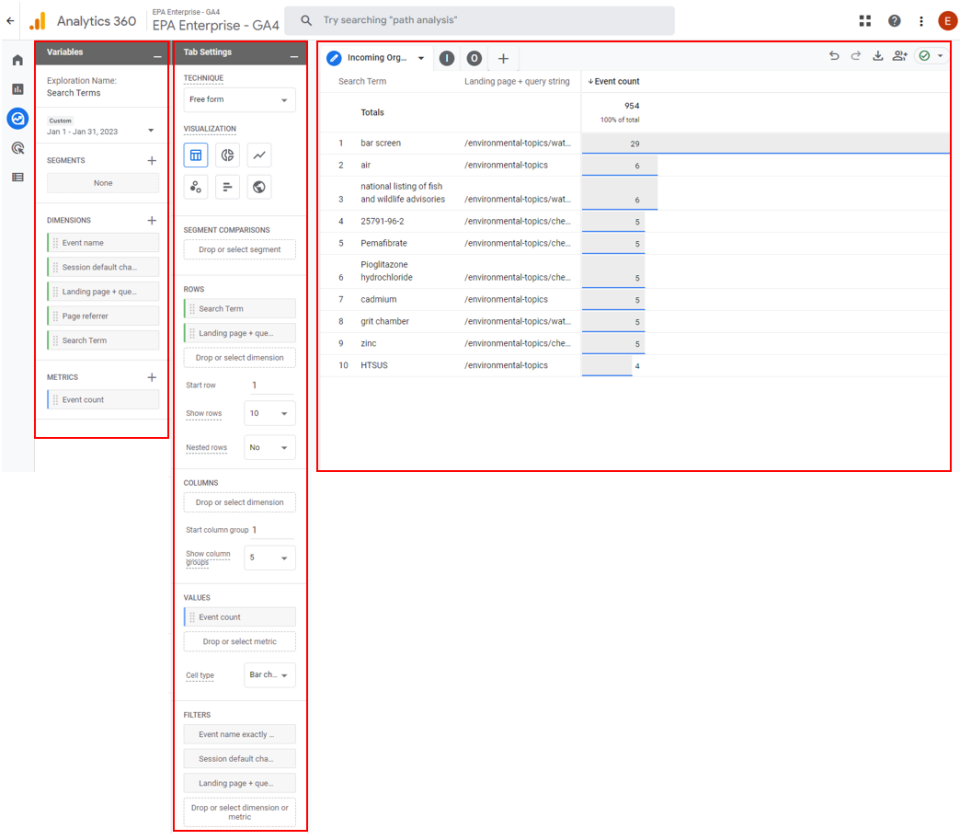
When you want to investigate certain pieces of data further, you can build an exploration for deeper investigation. Reports and explorations both provide actionable insights into your web data. Explorations query raw event and user-level data.
An exploration consists of 3 sections:
- Within explorations you can have multiple tabs, letting you use multiple techniques in a single exploration (e.g. Free-form exploration, Funnel exploration).
- Variables are a panel that gives you access to the dimensions, metrics, and segments you can use in the exploration. You can also change the timeframe of the exploration in the Variables panel.
- Tab Settings panel has options to configure the currently selected tab. Select the technique, add items from the Variables panel, and configure technique-specific options.
Explorations is subject to the following limits:
- You can create up to 200 individual explorations per user per property.
- You can create up to 500 shared explorations per property.
- You can apply up to 10 segments per exploration.
- You can apply up to 10 filters per tab.
If your exploration contains an incompatible combination of dimensions, metrics or both you will see the incompatible request icon asking that you update the request. Please see Understanding the Explore Area in GA4 for more in depth information on the Explore area.

Share and export the exploration
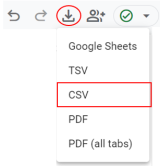
You can export and share Google Analytics reports in several different formats: Google Sheets, PDF, CSV, CSV for Excel, and TSV. Not all reports are available in all formats; it will be clear which options you have when you export the reports.
When you first create an exploration, only you can see it. You can share your insights with your colleagues with the click Share exploration. Shared explorations can be viewed, but not edited, by anyone who has the Viewer role to the property. You must duplicate or copy a shared exploration in order to edit it.

