Understanding Google Universal Analytics
Legacy content
This page is for Universal Analytics (UA). Find a page like this for Google Analytics 4 (GA4)
EPA content related to Google Analytics is changing.
Google's legacy platform, Universal Analytics (UA), will reach end of life in mid-2023 with a one-time extension for contracting clients such as EPA until July 1, 2024. See KB article.
In these Web Analytics pages, content for Universal Analytics is marked "Google Universal Analytics (legacy)."
Content for the new platform, Google Analytics 4, is marked "Google Analytics 4 (GA4)."
The videos on this page are taken from Google's Analytics Academy's Digital Analytics Fundamentals course. This course is available for free and it is strongly recommended that you take the entire course if you plan to be a regular user of Google Analytics. Once you are comfortable with the basics below, learn how to Make Google Analytics Work for You.
On this page:
- Introduction to Google Analytics
- Dimensions and Metrics
- Standard Reports
- Saving Reports
- Emailing and Exporting Reports
- Other Analytics Resources
Introduction to Google Analytics
Google Analytics provides quantitative data to help Web content owners and producers determine how to best serve their users. This video goes over the basics of digital analytics and why they are important.
To learn more about how Google Analytics is implemented at EPA, see Google Analytics: Data and Structure.
Dimensions and Metrics
All Google Analytics reports are made of two types of data: Dimensions and Metrics. Dimensions are characteristics or attributes that can be ascribed values (e.g. Page, Landing Page, City). Metrics are the measurable data that are associated with a Dimension's values (e.g. Pageviews, Bounce Rate). Dimensions describe and define data, whereas Metrics measure data. This video gives a brief overview of Dimensions and Metrics and how they structure the reports in Google Analytics. It is important to understand these terms in order to design custom reports and understand how to properly use filters.
You can look over the Metrics available in Google Analytics in the Glossary of Metrics Used in Google Analytics.
Standard Reports
Most of the data that you will be using can be found by navigating through the standard reports.

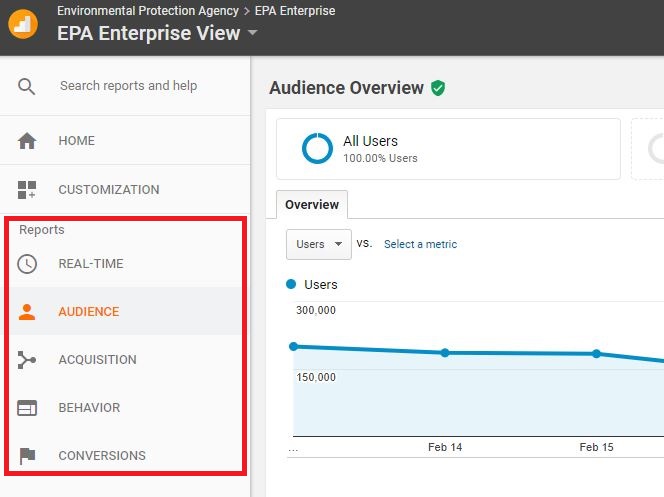
The standard reports are divided into five sections:
- Real-time - includes reports about user interactions happening at the time you are accessing the report.
- Audience - includes reports about user characteristics, including location, type of device, and session frequency. See Google's Audience Report video for more information.
- Acquisition - includes reports about how users are finding your website. See Google's Acquisition Reports video for more information.
- Behavior - includes reports about how users are interacting with your website. See Google's Behavior Reports video for more information.
- Conversions - includes reports about the completion of specific user tasks on your website. These reports require that you define goals in your Google Analytics account and are most often used by owners of e-commerce sites.
One of the best ways to learn about Google Analytics reporting is by clicking around and seeing how it works for yourself. There is plenty of guidance available at Google Analytics Help.
NOTE: If you generate a report with a very large number of rows, you may see "other" among the list of URLs. Google Analytics has a daily limit to how many rows of data it can process in a report table. Once that limit is reached, the data from the remaining rows are aggregated under the title “other.” This data is still available, but must be exported as an Unsampled Report.
Saving Reports
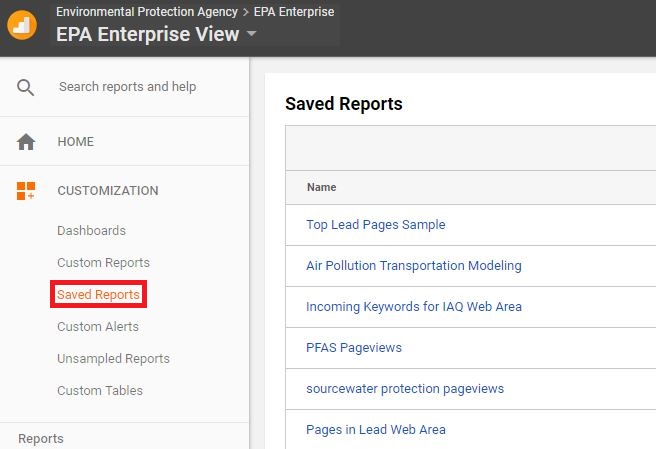
You can configure standard reports in a number of ways, including adding segments, filters or secondary (extra) metrics. If you find that you have configured a report you wish to retrieve often, you can save that report. Your Saved Reports will be stored under Customization.
- See also: Making Google Analytics Work for You goes over many of the different ways that you can slice GA data.

Step-by-step instructions for saving reports can be found in Google Help's Saved reports .
NOTE: A Saved Report is only visible to the user that created it. You can share it with the exporting and sharing functions.
Emailing and Exporting Reports
You can export and share Google Analytics reports in several different formats: PDF, CSV, CSV for Excel, and TSV. Not all reports are available in all formats; it will be clear which options you have when you export the reports.
You can share reports by email and you can also schedule reports to be sent by email regularly. You can schedule reports to be sent once, daily, weekly, monthly or quarterly.
Step-by-step instructions for exporting and emailing reports can be found at Google Help's Export and Email Reports.
NOTE: Only 500 rows of data can be exported into a CSV file. If you want to export more than 500 rows of data, you will need to follow the instructions for doing so at the Google Help link above. Keep in mind that exporting more than 500 rows of data it may cause the reports to load slowly or timeout.
Other Resources
Avinash Kaushik's blog Occam's Razor is an invaluable resource for information about Web analytics strategies. He is affiliated with Google so most of his posts take a Google Analytics view of Web analytics. The blog posts below may be particularly helpful for EPA web owners.
