Understanding Detailed Reports in GA4
EPA content related to Google Analytics is changing.
Google's legacy platform, Universal Analytics (UA), will reach end of life in mid-2023 with a one-time extension for contracting clients such as EPA until July 1, 2024. See KB article.
In these Web Analytics pages, content for Universal Analytics is marked "Google Universal Analytics (legacy)."
Content for the new platform, Google Analytics 4, is marked "Google Analytics 4 (GA4)."
This page describes the more detailed pages in the Reports area of Google Analytics 4. See also: Understanding the Home and Reports Areas in GA4.
On this page:
- User acquisition
- Traffic acquisition
- Events
- Pages and screens
- User demographics
- User tech
- Search queries
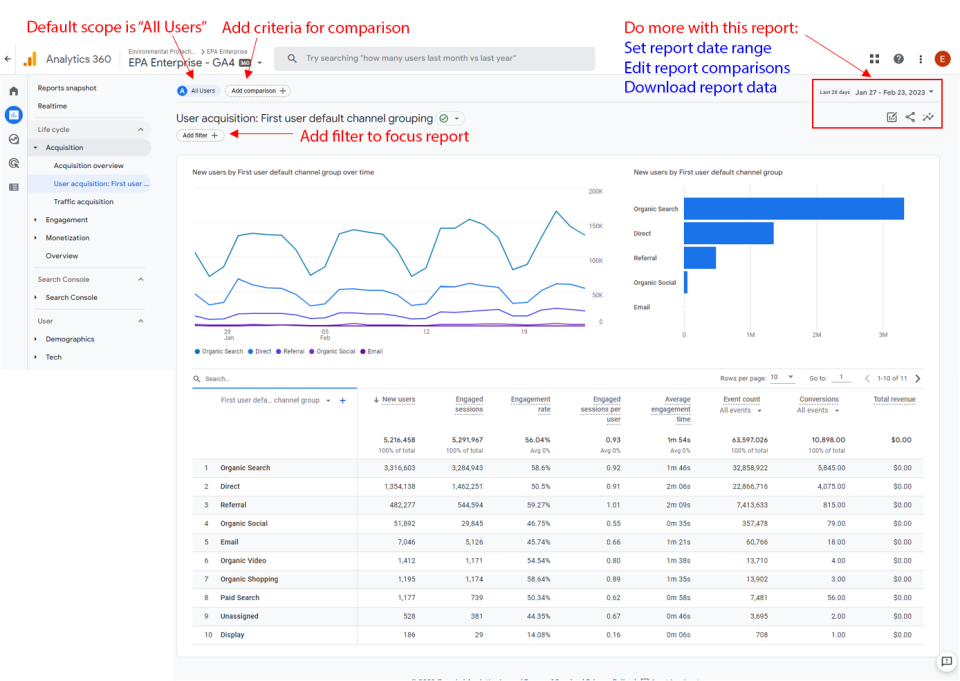
User acquisition
How to get to the user acquisition detail report page
- Click Reports > Life cycle > Acquisition > User acquisition: First user default channel grouping
Interact with the charts
- Set the desired date ranges for charts in the report
- Add and edit criteria for comparisons (e.g., mobile users; users who viewed a page or web area)
- Click the share button to download report data
- Add filter to focus report
Charts included in this page
- New users by First user default channel group over time
- New users by First user default channel group
- New users, Engaged sessions, Engagement rate, Engaged sessions per user, Average engagement time, Event count, Conversions, Total revenue; by First user default channel group
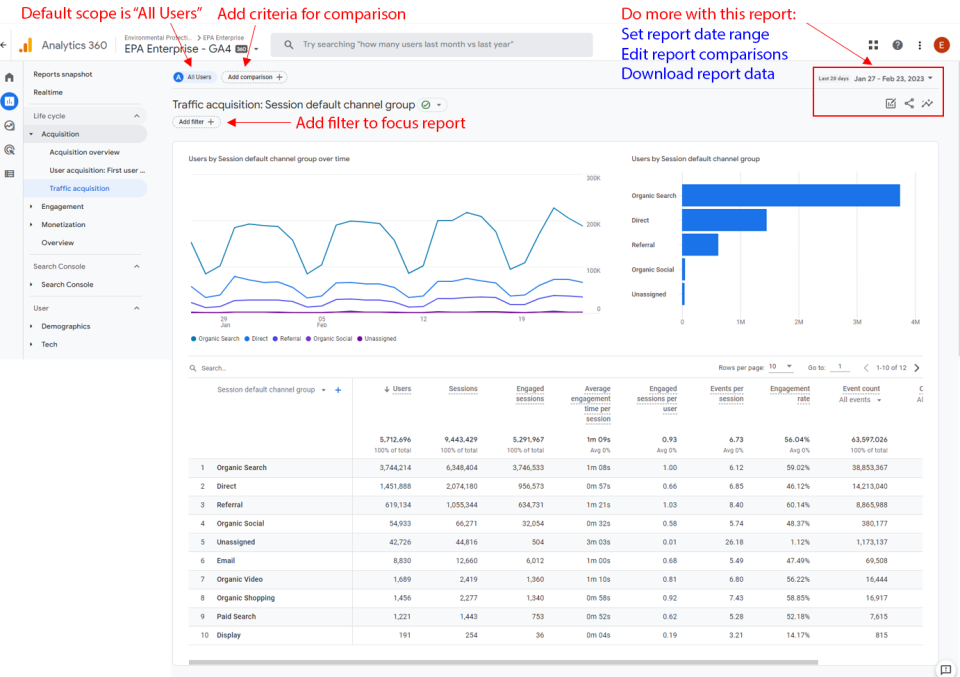
Traffic acquisition
How to get to the traffic acquisition detail report page
- Click Reports > Life cycle > Acquisition > Traffic acquisition
Interact with the charts
- Set the desired date ranges for charts in the report
- Add and edit criteria for comparisons (e.g., mobile users; users who viewed a page or web area)
- Click the share button to download report data
- Add filter to focus report
Charts included in this page
- Users by Session default channel group over time
- Users by Session default channel group
- Users, Sessions, Engaged sessions, Average engagement time, Engaged sessions per user, Events per session, Engagement rate, Event count, Conversions, Total revenue; by Session default channel group
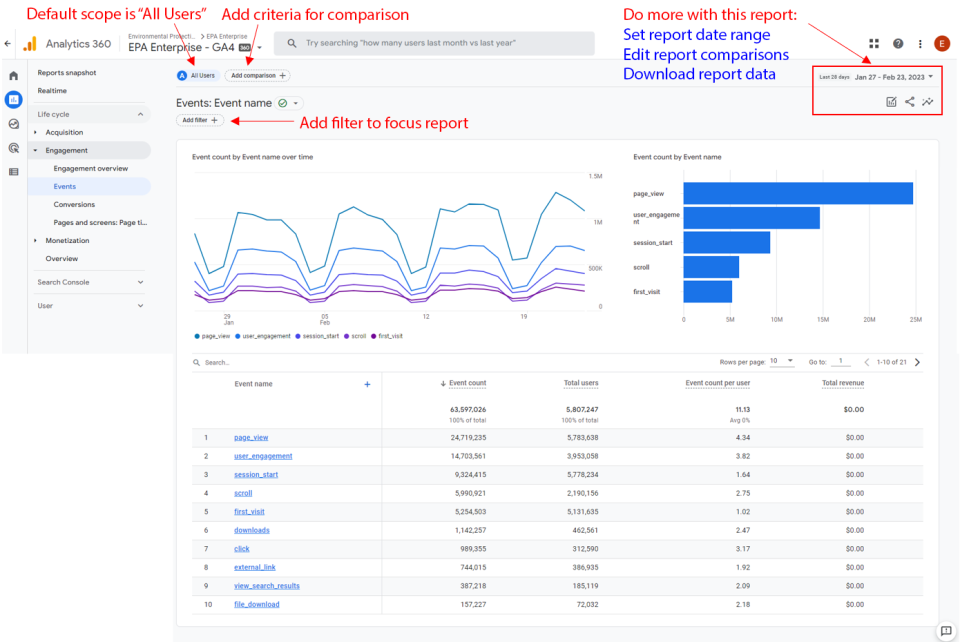
Events
How to get to the events detail report page
- Click Reports > Life cycle > Engagement > Events
Interact with the charts
- Set the desired date ranges for charts in the report
- Add and edit criteria for comparisons (e.g., mobile users; users who viewed a page or web area)
- Click the share button to download report data
- Add filter to focus report
Charts included in this page
- Event count by Event name over time
- Event count by Event name
- Event count, Total users, Event count per user, Total revenue; by Event name
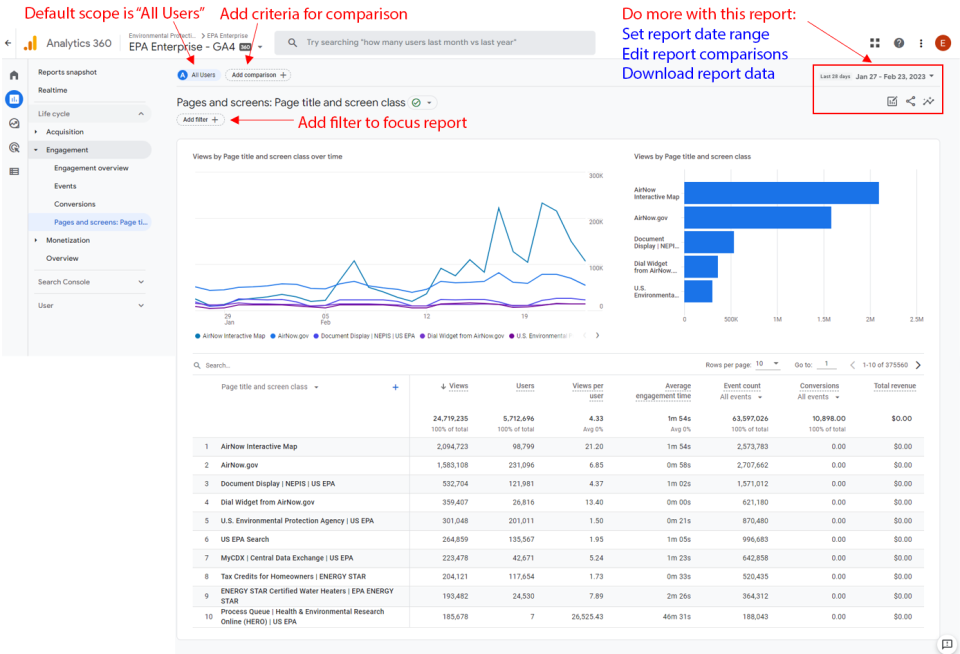
Pages and screens
How to get to the pages and screens detail report page
- Click Reports > Life cycle > Engagement > Pages and screens: Page title and screen class
Interact with the charts
- Set the desired date ranges for charts in the report
- Add and edit criteria for comparisons (e.g., mobile users; users who viewed a page or web area)
- Click the share button to download report data
- Add filter to focus report
Charts included in this page
- Views by Page title and screen class over time
- Views by Page title and screen class
- Views, Users, Views per user, Average engagement time, Event count, Conversions, Total revenue; by Page title and screen class
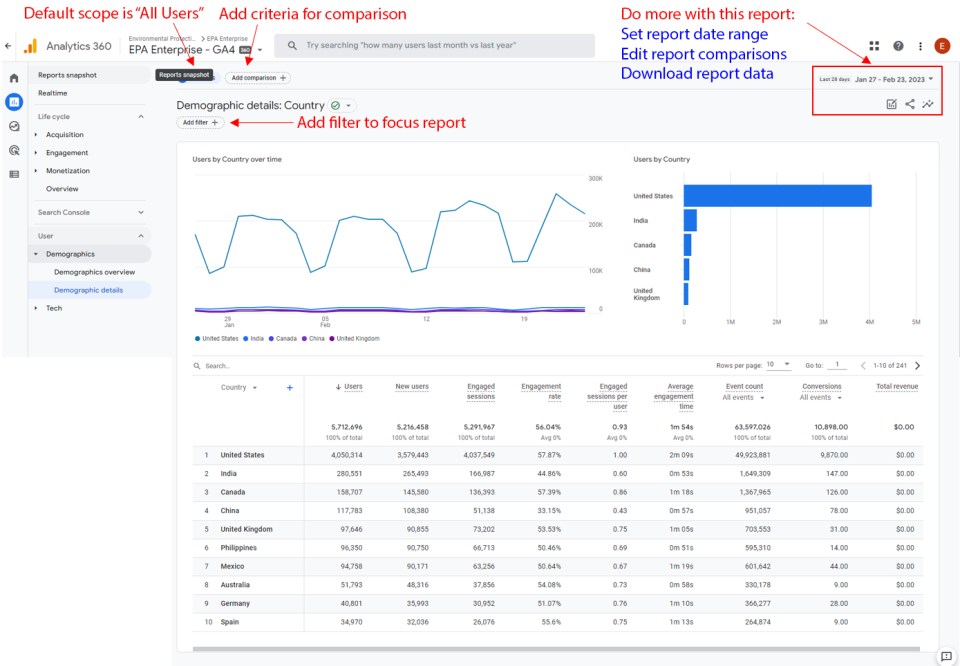
User demographics
How to get to the demographic details report page
- Click Reports > User > Demographics > Demographic details
Interact with the charts
- Set the desired date ranges for charts in the report
- Add and edit criteria for comparisons (e.g., mobile users; users who viewed a page or web area)
- Click the share button to download report data
- Add filter to focus report
Charts included in this page
- Users by Country over time
- Users by Country
- Users, New users, Engaged sessions, Engagement rate, Engaged sessions per user, Average engagement time, Event count, Conversions, Total revenue; by Country
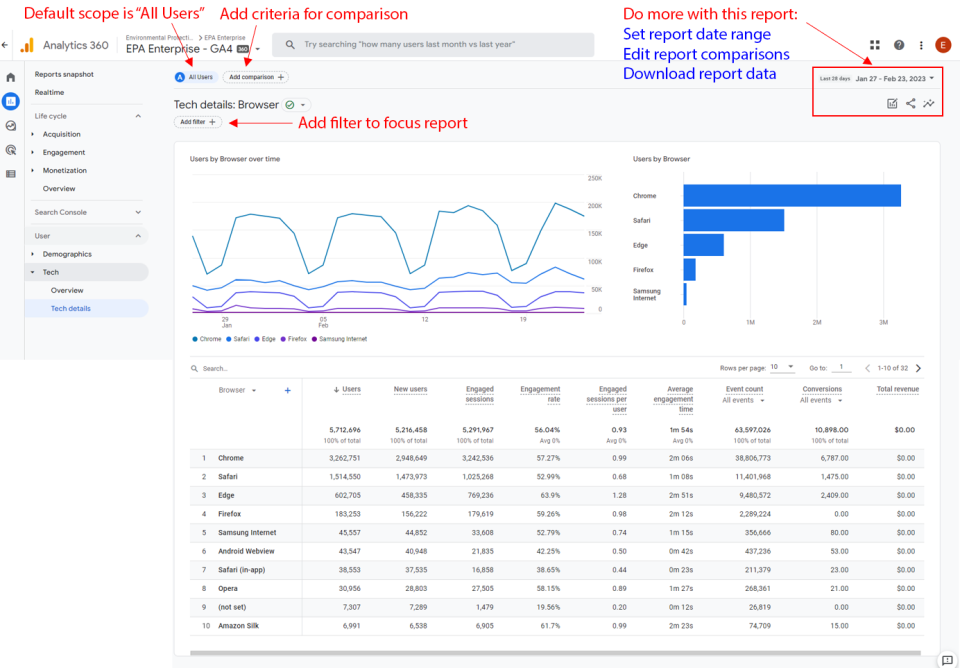
User tech
How to get to the tech details report page
- Click Reports > User > Tech > Tech details
Interact with the charts
- Set the desired date ranges for charts in the report
- Add and edit criteria for comparisons (e.g., mobile users; users who viewed a page or web area)
- Click the share button to download report data
- Add filter to focus report
Charts included in this page
- Users by Browser over time
- Users by Browser
- Users, New users, Engaged sessions, Engagement rate, Engaged sessions per user, Average engagement time, Event count, Conversions, Total revenue; by Browser
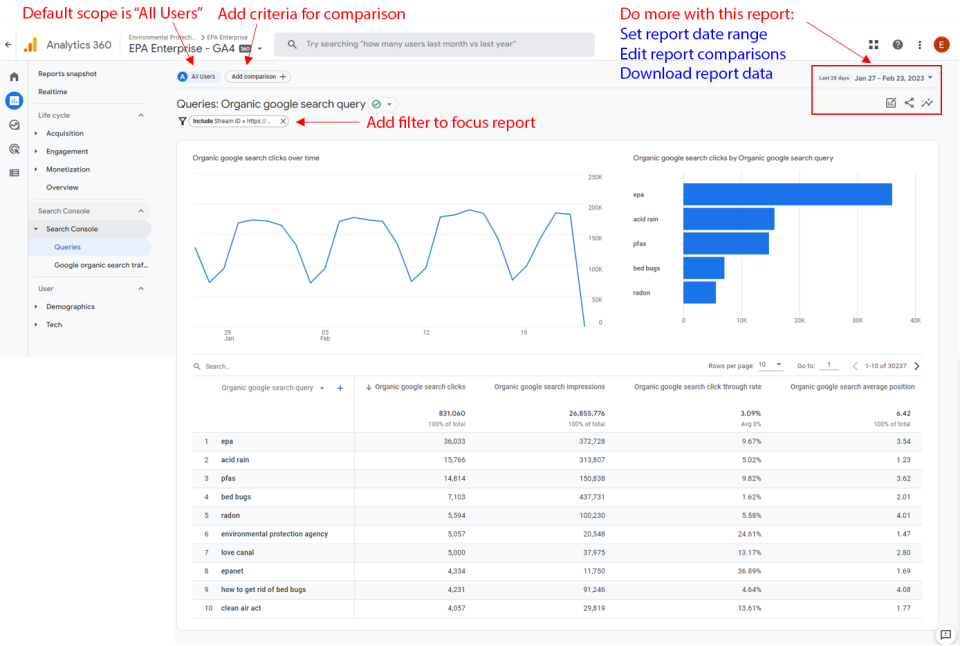
Search queries
How to get to the search queries detail report page
- Click Reports > Search Console > Search Console > Queries
Interact with the charts
- Set the desired date ranges for charts in the report
- Add and edit criteria for comparisons (e.g., mobile users; users who viewed a page or web area)
- Click the share button to download report data
- Add filter to focus report
Charts included in this page
- Organic google search clicks over time
- Organic google search clicks by Organic google search query
- Organic google search clicks, Organic google search impressions, Organic google search click through rate, Organic google search average position; by Organic google search query